UNIANOVA anxiety BY intervention_categorical
  /METHOD=SSTYPE(3)
  /INTERCEPT=INCLUDE
  /CRITERIA=ALPHA(0.05)
/DESIGN=intervention_categorical.Reproducible science without coding
open science
reproducibility
coding
Completing an analysis with coding, and making the code publicly available could be considered high on the ladder of reproducible practices. Code is an exact step by step description of the analysis which can help someone reproduce your findings.1 Not everyone has the time to learn coding though. Learning coding can seem like an insurmountable task, especially if you’ve used point-and-click interfaces (like SPSS) for the majority of your career, have a workload packed with teaching and admin, while also trying to get your research published in a timely manner because academia can sometimes feel like a hostile frozen wasteland that equates your worth as a human being with how much you publish.
I’ve done my fair share of re-analysis work in the past couple of years. My MSc work included re-analysing over 400 meta-analyses, and we’ve recently re-analysed over 200 analyses for a pilot study (all done with the help of two brilliant undergraduate students). Along the way, I’ve compiled a mental checklist of open science practices that can make attempts to reproduce someone’s work headache-inducing at best and impossible at worst, but also practices that make me want to clutter the authors’ mailboxes with unsolicited ‘thank you’ e-mails and dog gifs.
This post provides an overview of both. Most examples are focused on SPSS, but the main points apply for users of any point-and-click software. Some of these points may seem really obvious. Experience has taught me otherwise.
Make your data available
This goes without saying, but “data available upon request”, are data available temporarily. You will eventually lose access to your repository, lose the memory stick, get a new computer, or lose contact of the person who is responsible for maintaining the data. A response I got a few times was “This was a project conducted by my PhD student, I don’t have their contact details anymore.”2.
Use a well known repository. Using an obscure repository is fine if a researcher is trying to locate the data specifically for your study (because presumably this would be linked to your publication). Other times, researchers might want to get a random sample of data from a repository (e.g. for meta-science studies), or they might be searching existing repositories for unpublished data to include in their meta-analyses as a way of mitigating publication bias.
The repositories that I commonly use include the Open Science Framework and GitHub, and this Nature article provides a list of discipline-specific repositories.
Name your variables
Give your variables meaningful names that can be easily linked to the variables you talk about in your paper. SPSS used to have a limit of 8 characters for variable names, but this is no longer the case in newer versions (unless you’re using Process). If the dataset you upload consists of 300 columns titled Q1 - Q300, or whatever the default is for the software that originally collected your data, the study is not reproducible. Researches shouldn’t need to contact you to make sense of your data. See point (1).
Write a codebook. Create a document that describes exactly what each column of a dataset refers to, including how levels of categorical variables are labelled. Upload this document along with the data. This is important regardless of whether you gave your variables meaningful names - the names might be obvious to you, but might not always make sense to others. A codebook gets around this problem.
Ensure reproducibility at different levels of the analysis
This often applies to studies that contain trial level data - for example reaction time data from a computer-based experiment that can span across thousands of rows for each participant. I believe these are uploaded with the best intentions, but the accompanying description in the paper rarely gives enough detail to compile these into a dataset that was eventually used for the analysis reported in the paper. If you have trial level data for individual participants, it’s great to upload these (in an accessible format), but you should also upload a data file that contains the computed variables that you used to run your analysis.
Same goes for psychometric measures and scores from individual items - the dataset you share should ideally contain your raw scores from individual questions as well as the composite scores used for the analysis. This way, the researcher using your data can decide which level of detail they need.
Share the syntax
You don’t need to code to be able to share the analysis syntax. Every time you run a command in SPSS, the output provides you with the code that runs in the background. For example running an ANOVA through:
Analyze > General Linear Model > Univariate
prints two things into your output file. Your analysis results, but also the syntax that corresponds to the above commands. The syntax always comes before the actual stats results, and in this case looks like:
There are wizards out there who conduct whole analyses by writing their own SPSS syntax from scratch. I’m not one of them, but if I look at a snippet of code like the one above, it’s pretty clear to me what kind of analysis I need to run and which variables to use if I want to reproduce the analysis.
An effortless thing to do is to simply upload the output file with the .spv extension into a repository with the rest of your data and materials. However, just like with SPSS-produced data files, the output format is also native to SPSS and could be difficult to open without access to an SPSS license. You can export the output through File > Export, and select the .txt option.
Important: some things don’t get printed as syntax. As a general rule, anything that you do via the menus will get written into the output file. Any deletions or edits done directly to the data file in the Data View will not. Therefore you should avoid deleting any columns or manually changing the values inside the cells. If, for whatever reason, you want to exclude cases, you should do so by applying the filter via Data > Select cases. This way any exclusions will be reflected in the syntax.
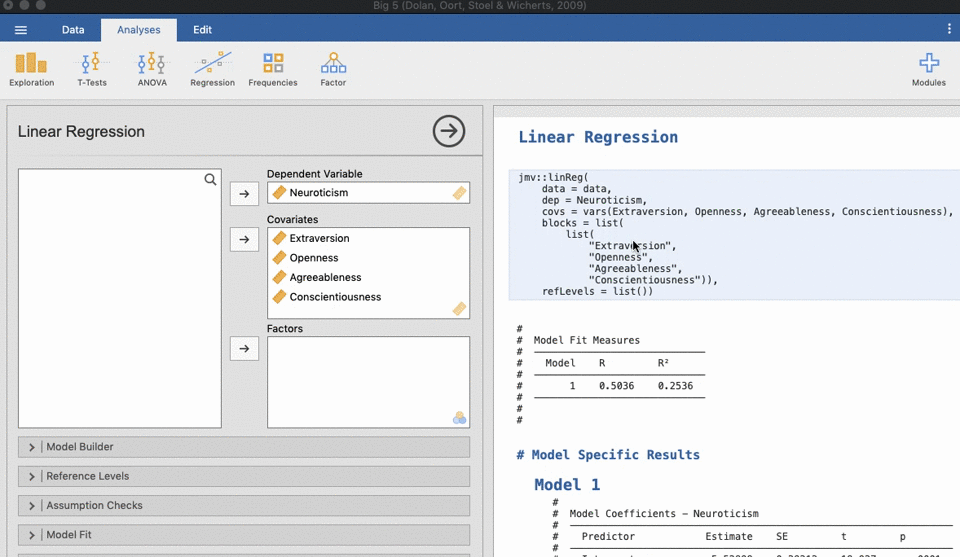
Exporting code from Jamovi or JASP. Like SPSS, Jamovi and JASP have a point-and-click interface and don’t require the knowledge of coding. That’s about where the similarities end. Jamovi and JASP are free, intuitive to learn, and generally a lot more pleasant to use. If you haven’t tried them out yet, you should give it a go.
Both pieces of software run R under the hood. JASP doesn’t seem to have the functionality to export code at the moment, but it seems like this is planned for future releases. Jamovi has the advantage of being able to display the code directly - you can add the code into the output by clicking the three dots in the top right and selecting Syntax mode:
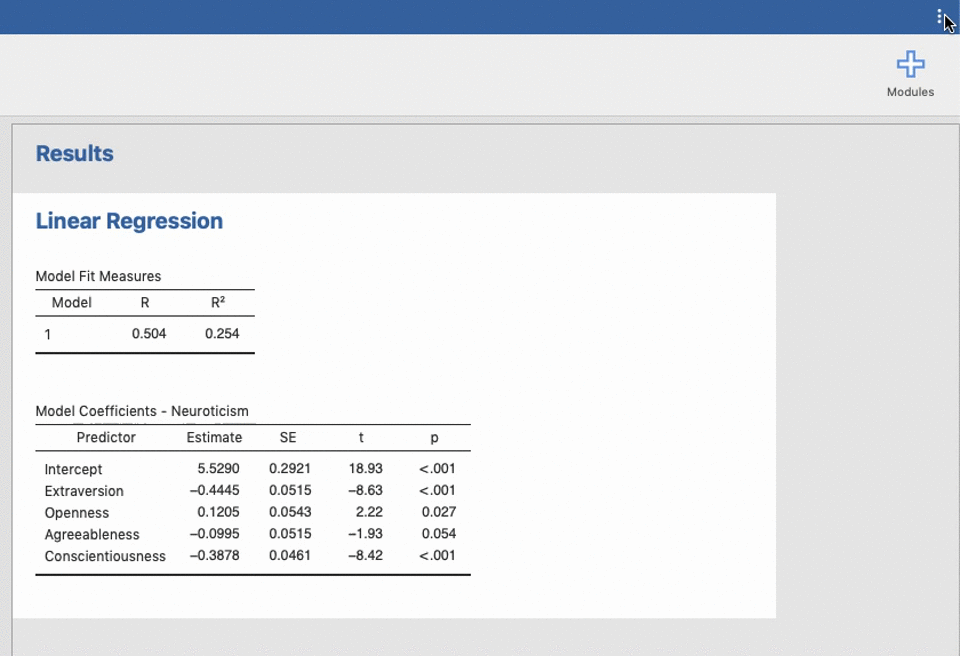
Jamovi will then print the R code that produced your results. I’m copying an example below because I can’t bear the thought of my first blog post containing SPSS syntax and no R code:
jmv::linReg(
    data = data,
    dep = Neuroticism,
    covs = vars(Extraversion, Openness, Agreeableness, Conscientiousness),
    blocks = list(
        list(
            "Extraversion",
            "Openness",
            "Agreeableness",
            "Conscientiousness")),
    refLevels = list())
Exporting the code from Jamovi requires a tiny bit more work than exporting from SPSS. Jamovi does have a simple Export function, but this only exports the output without the syntax. To get the syntax, you need to right-click on the the output, select “Syntax” and “Copy”. Then create a new file in either Notepad (Windows) or TextEdit (Mac), and paste the copied content in there. Add descriptions of which part of your analysis each bit of code belongs to.
And finally…
Respond
If you follow the tips from this post, there’s a good chance that researchers will happily carry on with their analyses without the need to get you involved. However sometimes they might still want to get in touch to ask you about the details of your analysis. If that does happen, respond. Open scholarship and transparency are crucial for improving the credibility of science, and we can only achieve this if we all set these as objectives to work towards.